Resources
People have been adding graphics to live broadcasts since the 1950s to enhance the viewing experience and communicate more information. Today, streaming overlays play a huge role in making live video content more engaging, while still delivering key information. Here’s why visual storytelling through overlays plays a key role in how to get more viewers.
Live stream graphics deliver stronger visual storytelling, not only through the improved aesthetics and production value, but also with the vast amount of information you can communicate. Instead of a steady stream of words, the placement, color themes, fonts, and text you highlight can divert a person’s attention and communicate layers of key information.
Streaming graphics simplify and contextualize data, highlighting the most important parts of what you want to about. This provides visual stimulation, making your live stream more engaging and therefore more memorable – bringing people back again and again for your next live stream and maintaining attention spans.

With overlays, data visualization extends far beyond what you can do in an excel spreadsheet. When you’re discussing news and politics, overlays can help your audience literally see the bigger picture of what’s going on.
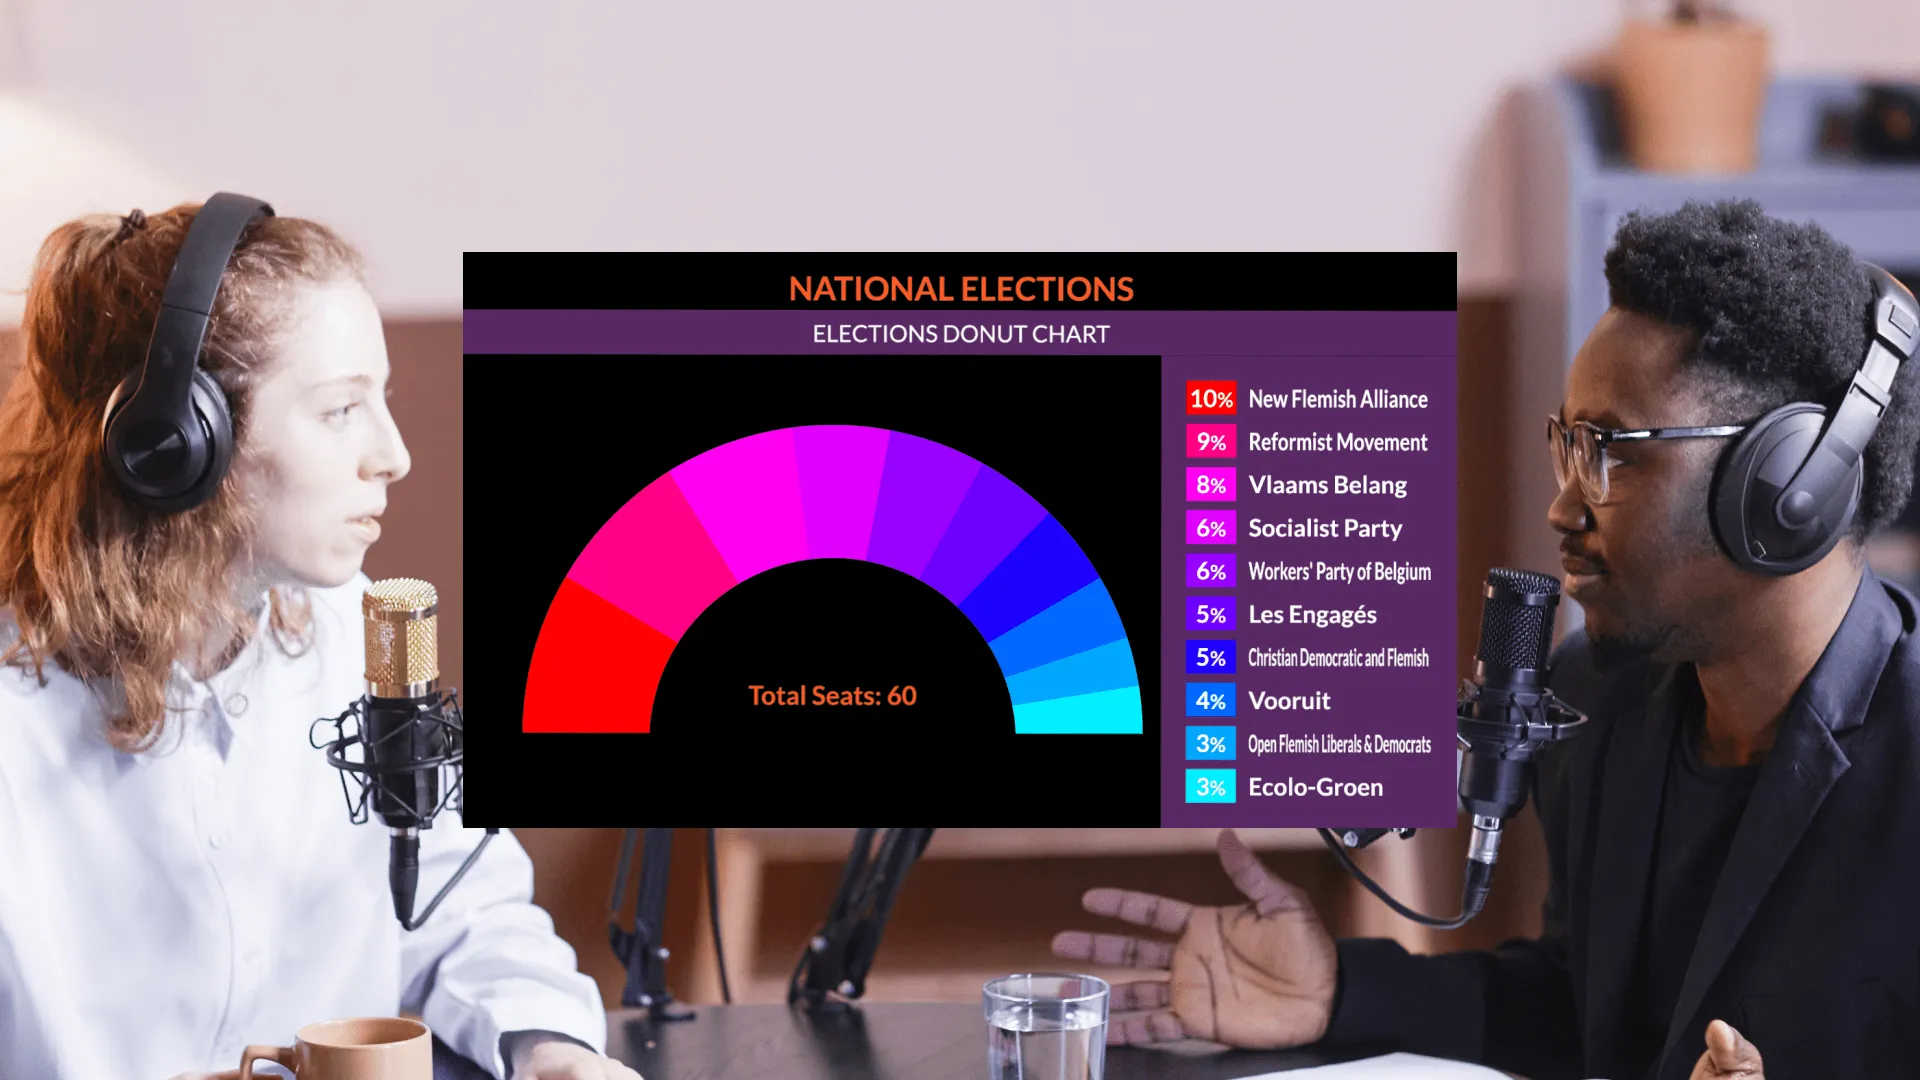
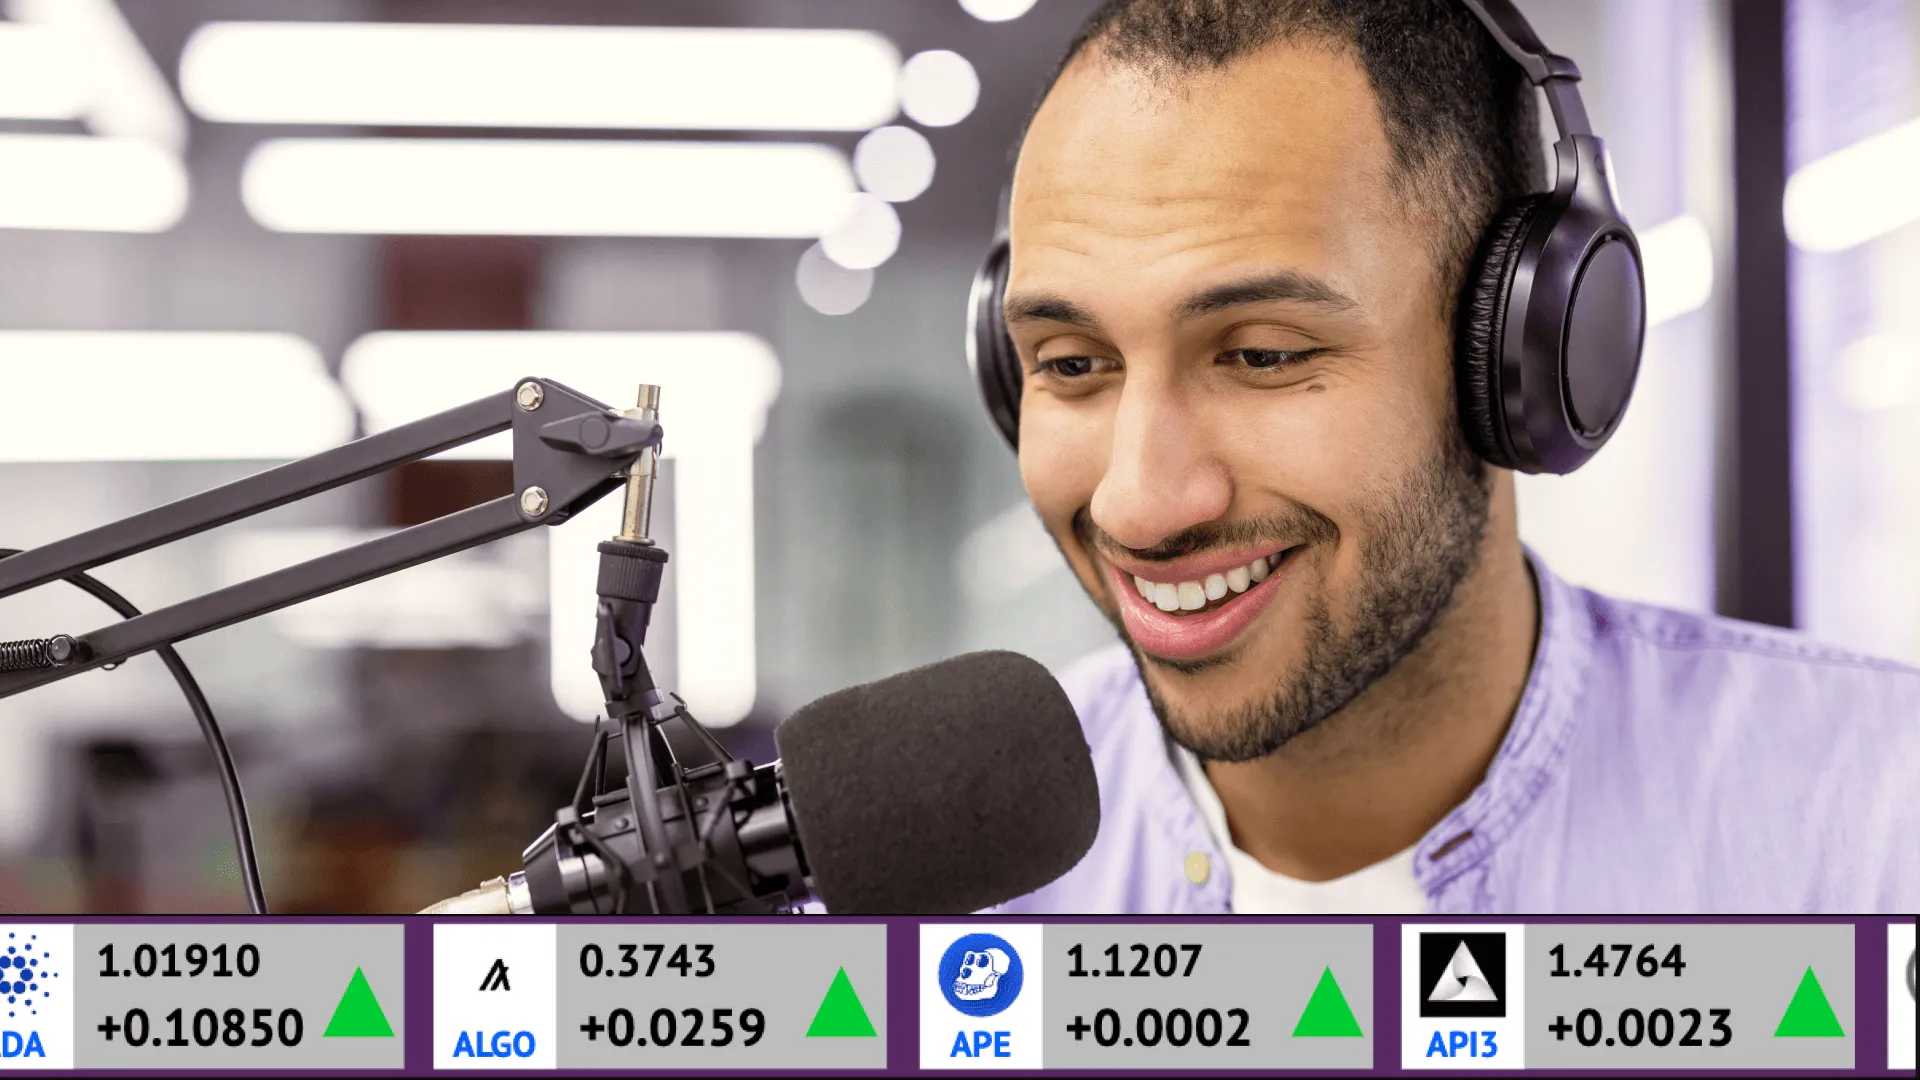
Overlays are also a great tool to translate raw data from RSS feeds into dynamic images and text that are easier for your viewer to digest. This helps you summarize key trends while making sure your content looks nicer overall.
Visualization in overlays goes beyond what you might first consider as delivering mass amounts of information, because you’re so used to it!
For example, when you watch a sports live stream, you’re processing large amounts of data translated into live stream graphics. The design of a scoreboard communicates numerous things to viewers at once, including which team has scored what, the number of fouls and penalties, and much more.
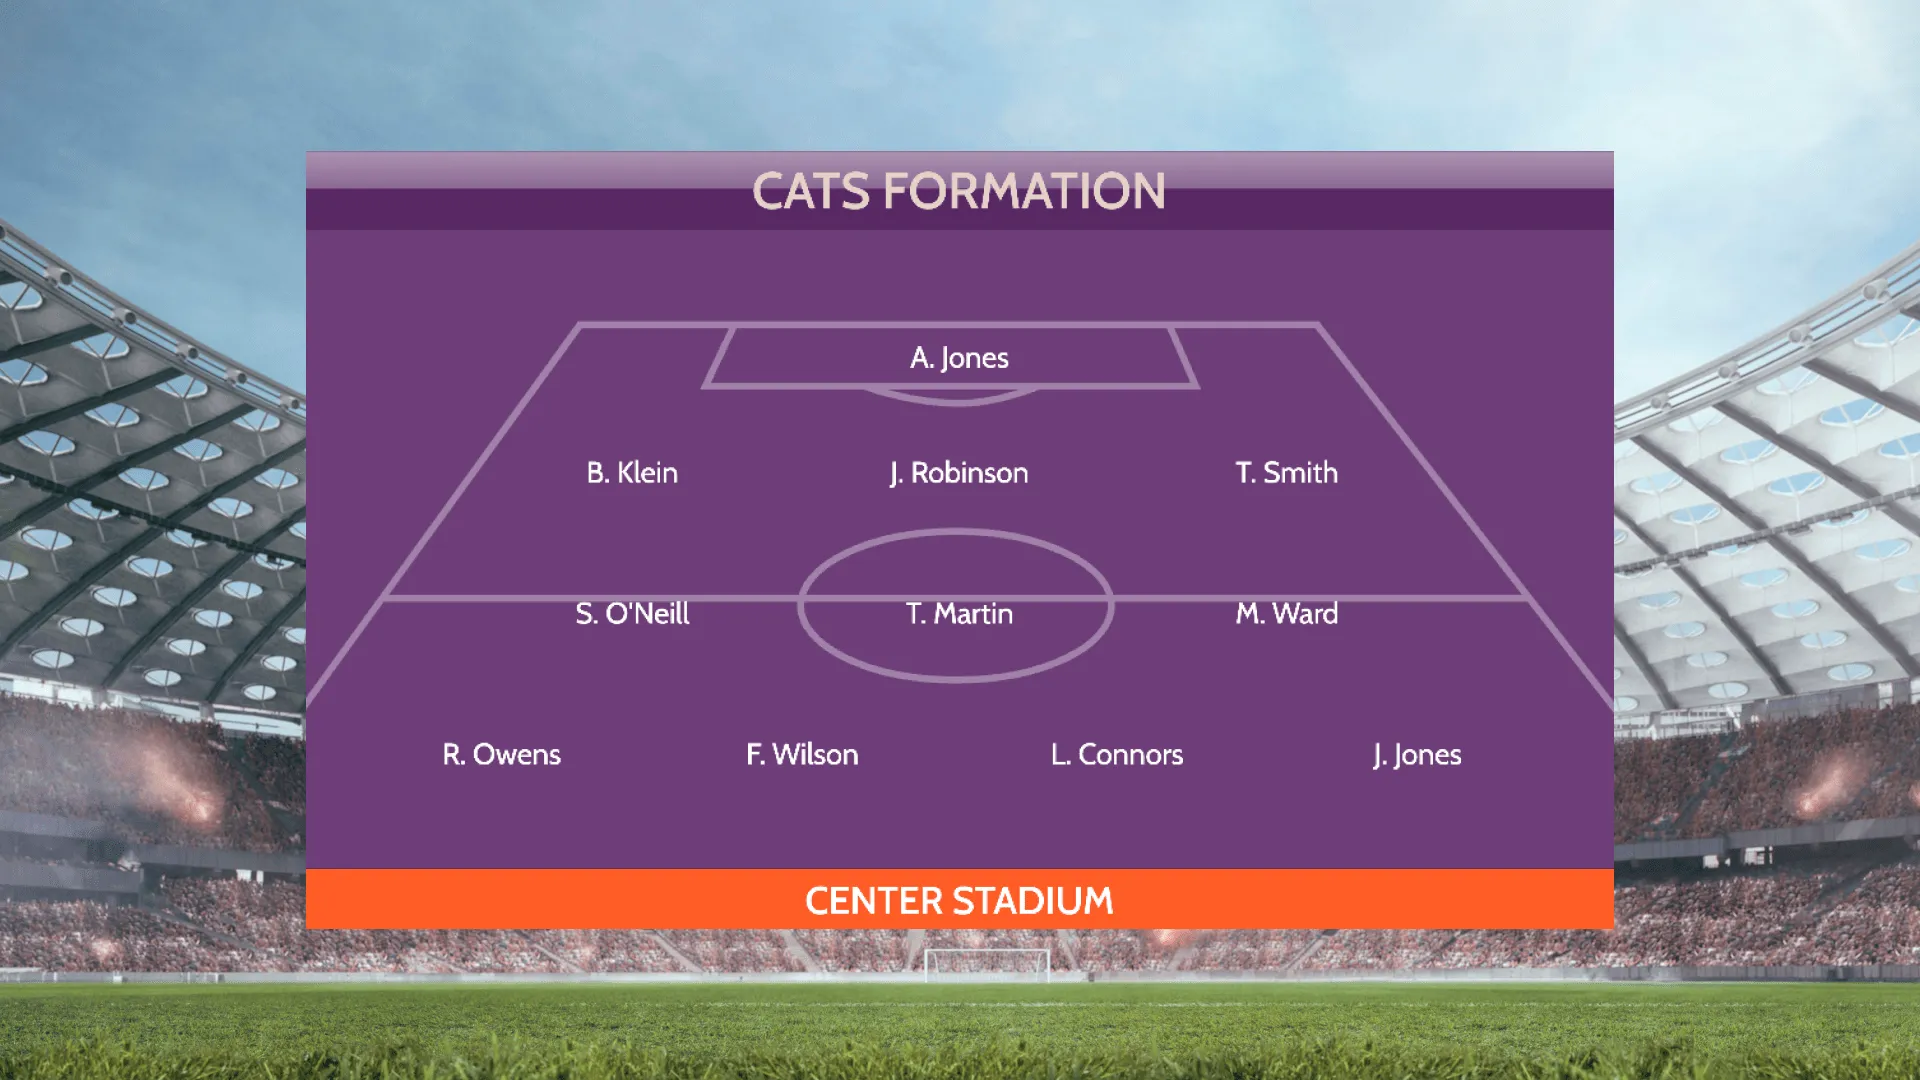
A simple soccer formation overlay delivers key insights about each player’s importance, their role, and their capabilities – all within seconds of seeing the screen. That’s why a sports broadcast with more overlays feels like a fuller, more satisfying production.
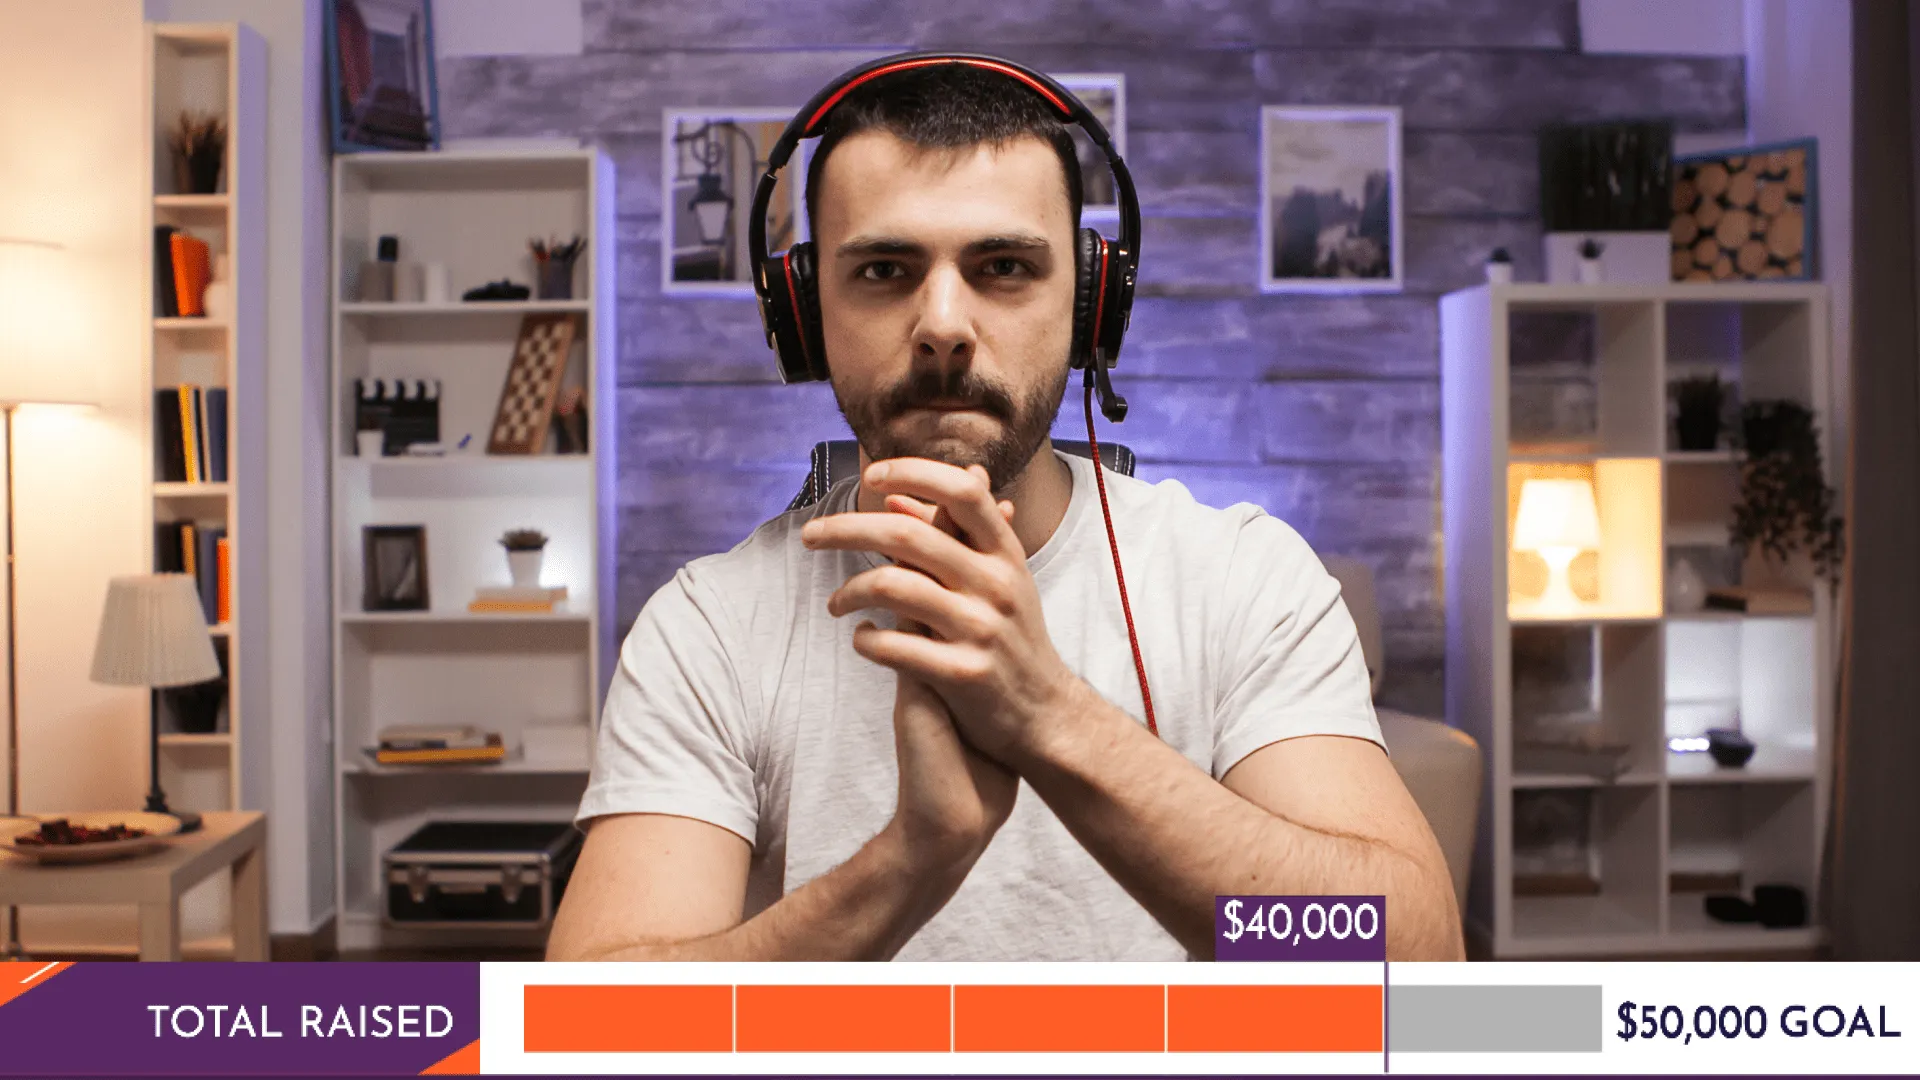
Even if you’re just one person live streaming your gameplay or running a Just Chatting channel on Twitch, data visualization plays an important role in how to get people to watch your stream. That can be as simple as highlighting key talking points, but it can also include adding a progress bar of close you are to reaching stretch goals or objectives. People often judge timelines and progress a lot better when they see it visually represented on a screen – that’s why most loading screens have a progress bar rather than numbers.
This blog has just scratched the surface of what’s possible with data visualization in overlays. There are several ways to deliver key information to your audience during your live stream, while adding production value and increasing viewer engagement.
Explore our extensive library of free stream overlays with the functions and features you need. And, join our Discord and discover even more ideas on how to get more viewers with data visualization.

